Overview
Wheely Weather answers one near-term riding question: is it worth going now? General forecasts show the numbers, but they still leave cyclists to translate wind, rain, temperature, daylight, and air quality into a decision.
I designed and built it as a focused web app: verdict first, evidence close, and a next ride window when the answer is no.
- Question
- Is it worth riding right now?
- Audience
- Recreational and commuter cyclists planning short-term rides.
- Core decision
- Score the weakest weather signal instead of averaging risk away.
- Shipped as
- A focused Astro and React app on Cloudflare Pages using Open-Meteo and NWS data.
The Decision Moment
Before a ride, I was checking one weather app and falling back to another when the first came up short. The data was available, but the call was not. Six conversations with recreational and commuter cyclists confirmed the same pattern: feels-like temperature mattered more than the actual number, wind canceled more rides than rain, and one bad condition could override an otherwise decent forecast. That last point drove the most important system decision: average the signals and you smooth away the condition that was actually going to cancel the ride. Scoring by the weakest signal instead kept the verdict honest.
That kept the scope tight. The app had to work at a glance on a phone, state the recommendation clearly, and still show enough evidence for riders who wanted to check the call.
Product Direction
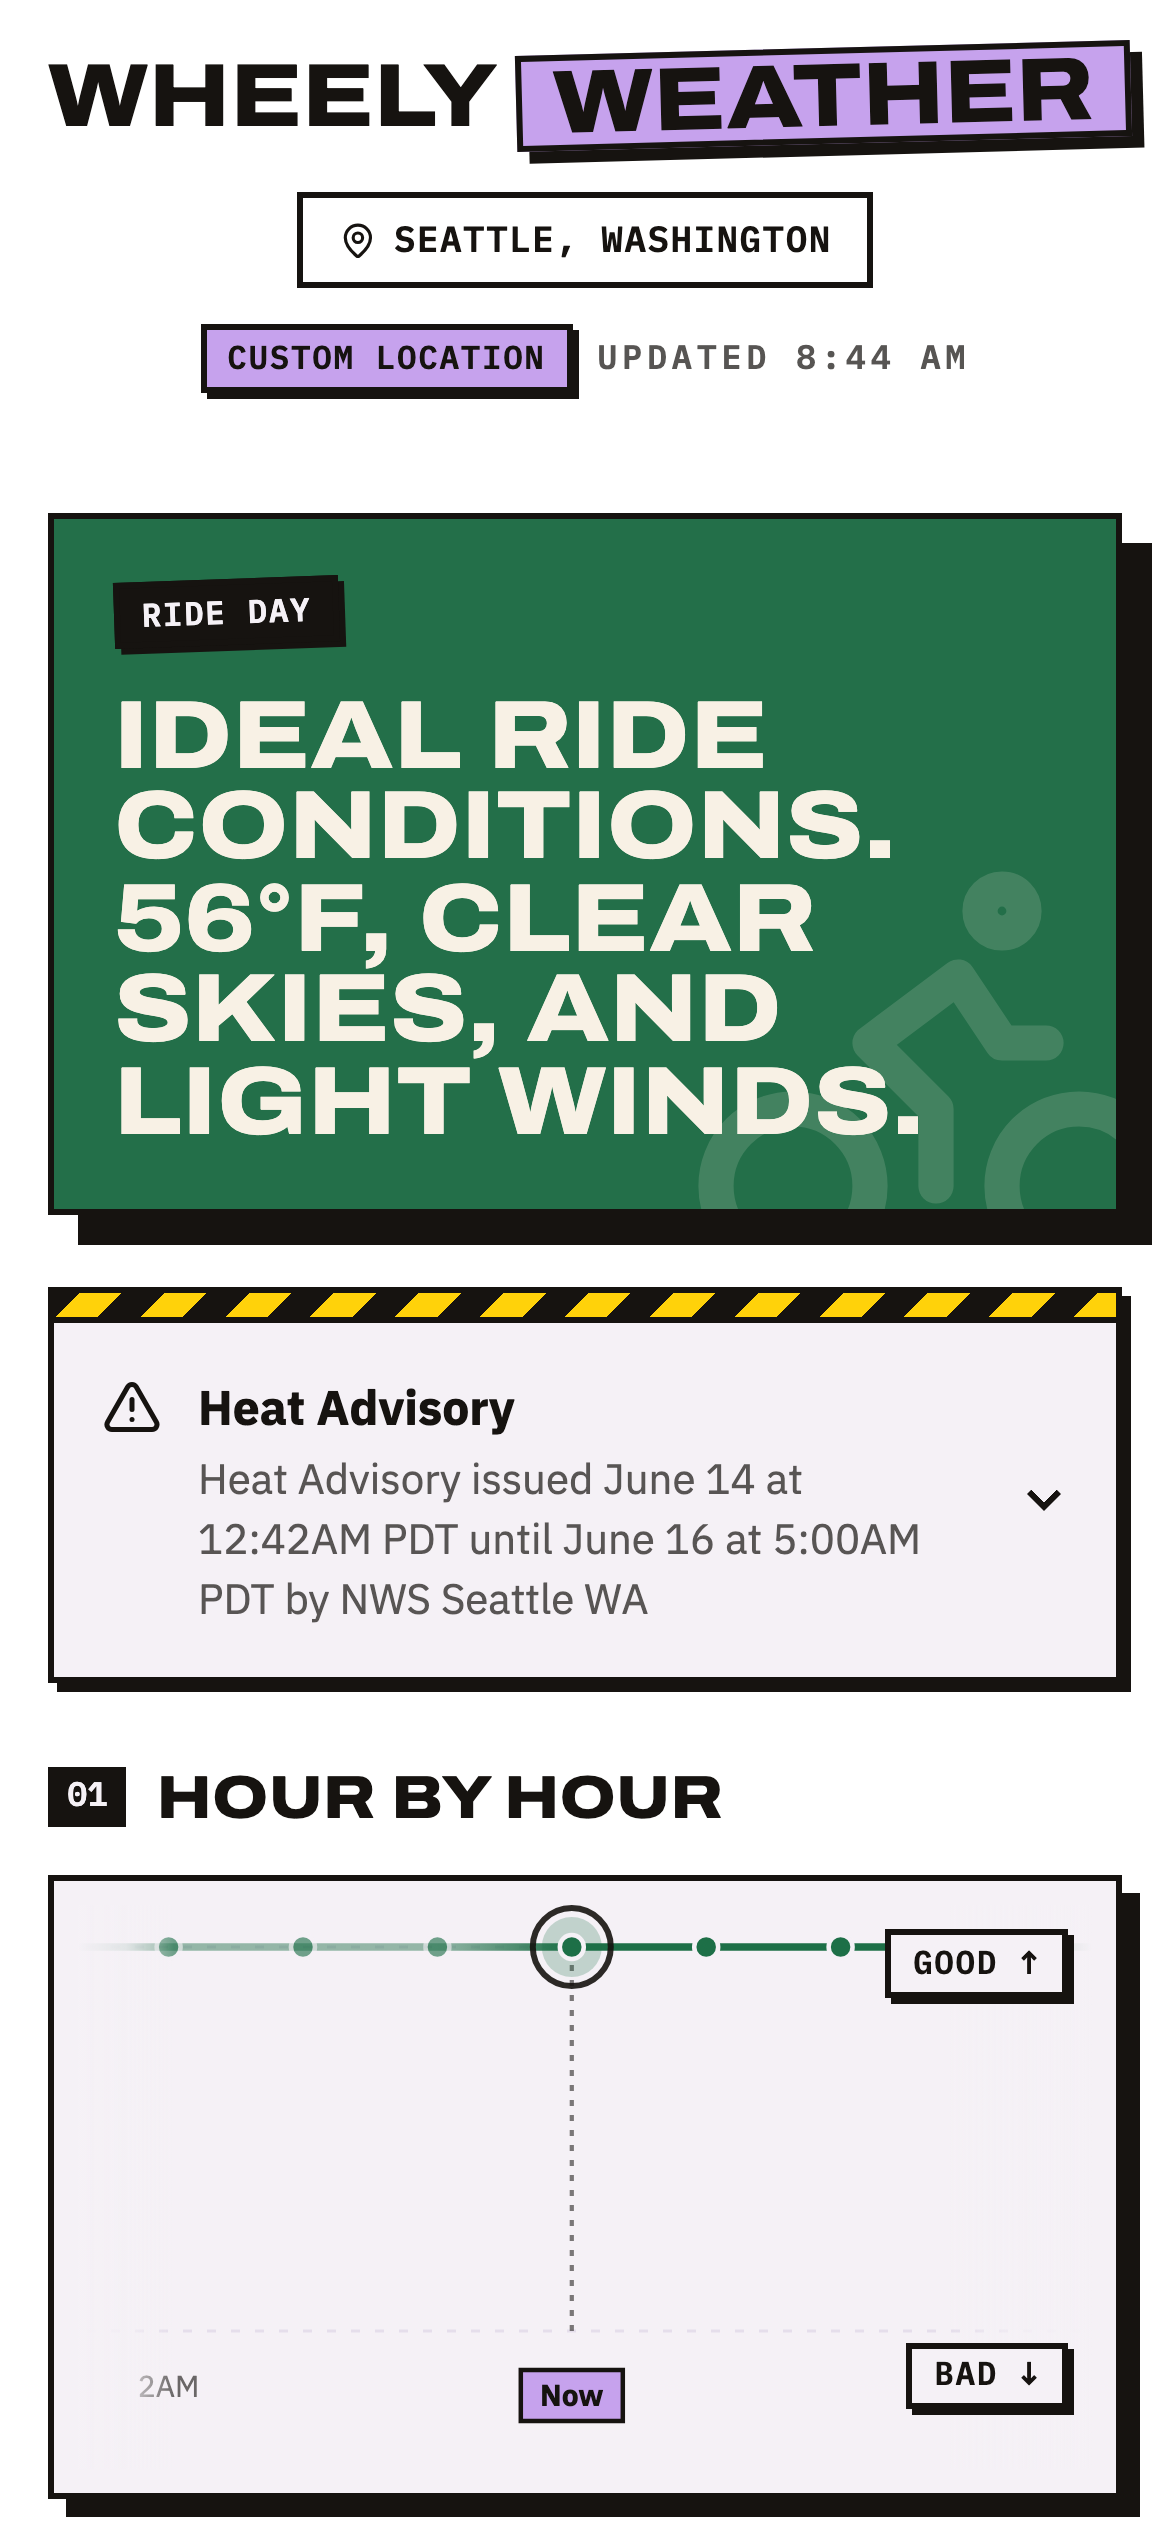
- Lead with a five-level ride rating: Great, Good, Fair, Poor, or Bad.
- Score the weakest riding signal instead of averaging bad conditions away.
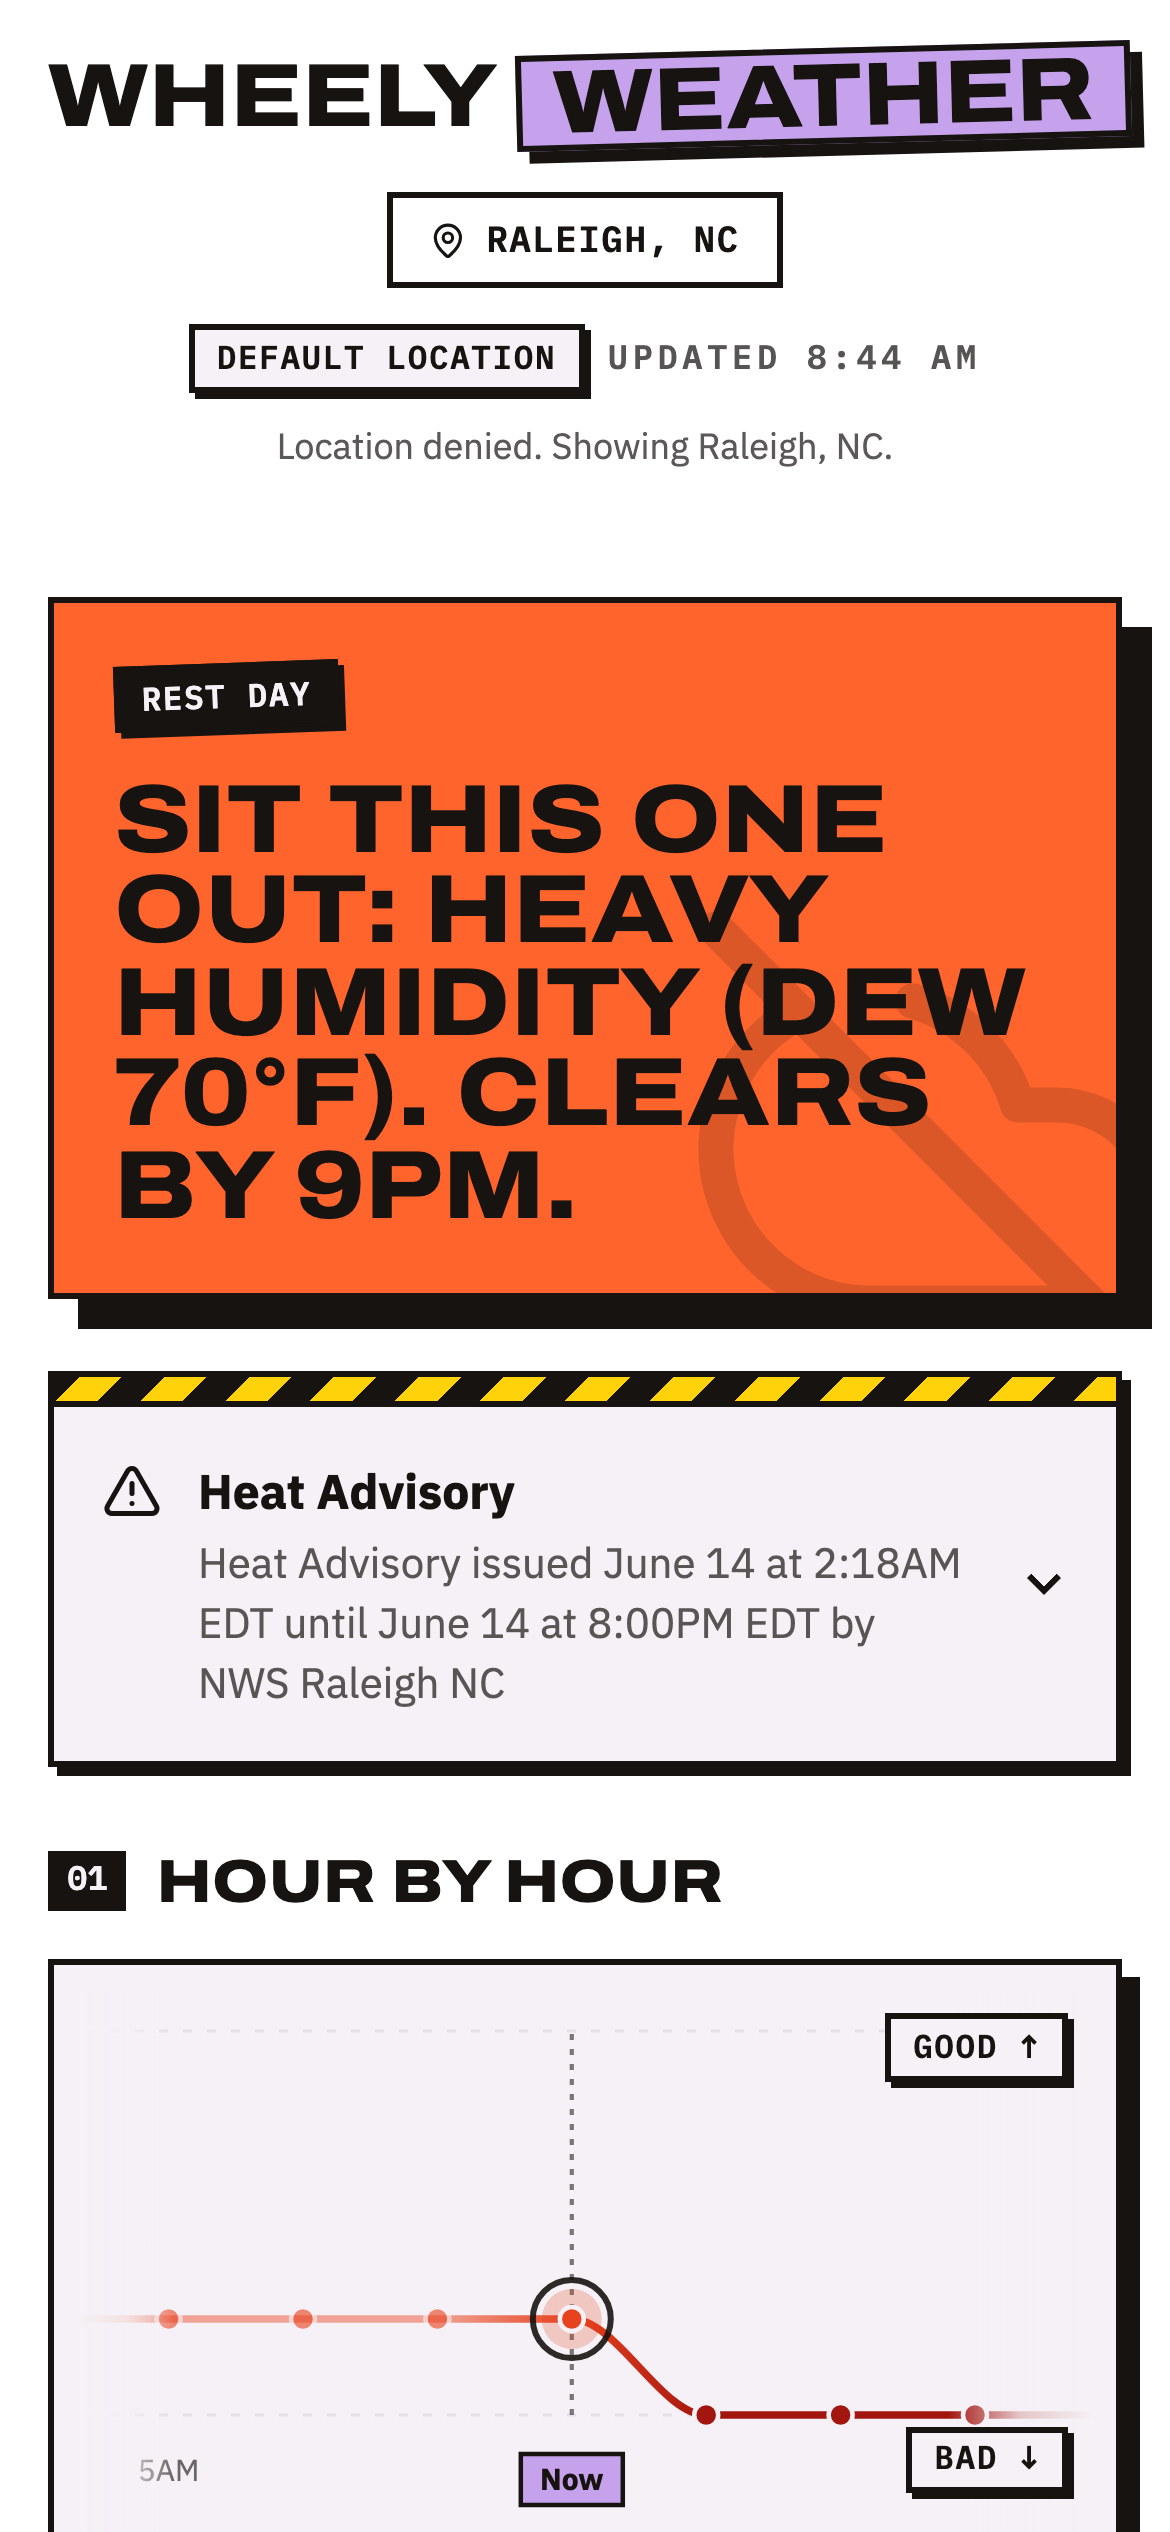
- Name the limiting condition when the ride rating drops.
- Keep the raw weather signals visible for riders who disagree with the recommendation.
- Point to the next usable window before asking anyone to study a chart.
- Guide kit selection from the same data, so no separate clothing app is needed.
System Design
The screen order follows the rider’s question sequence instead of the shape of a forecast API: can I go, why did it get that rating, what should I wear? The verdict card uses color and a plain-language label rather than a numeric score — a number would push the threshold decision back onto the rider, which is exactly what the app is trying to resolve. The Numbers panel keeps the raw signals close to the verdict, so the recommendation stays explainable.
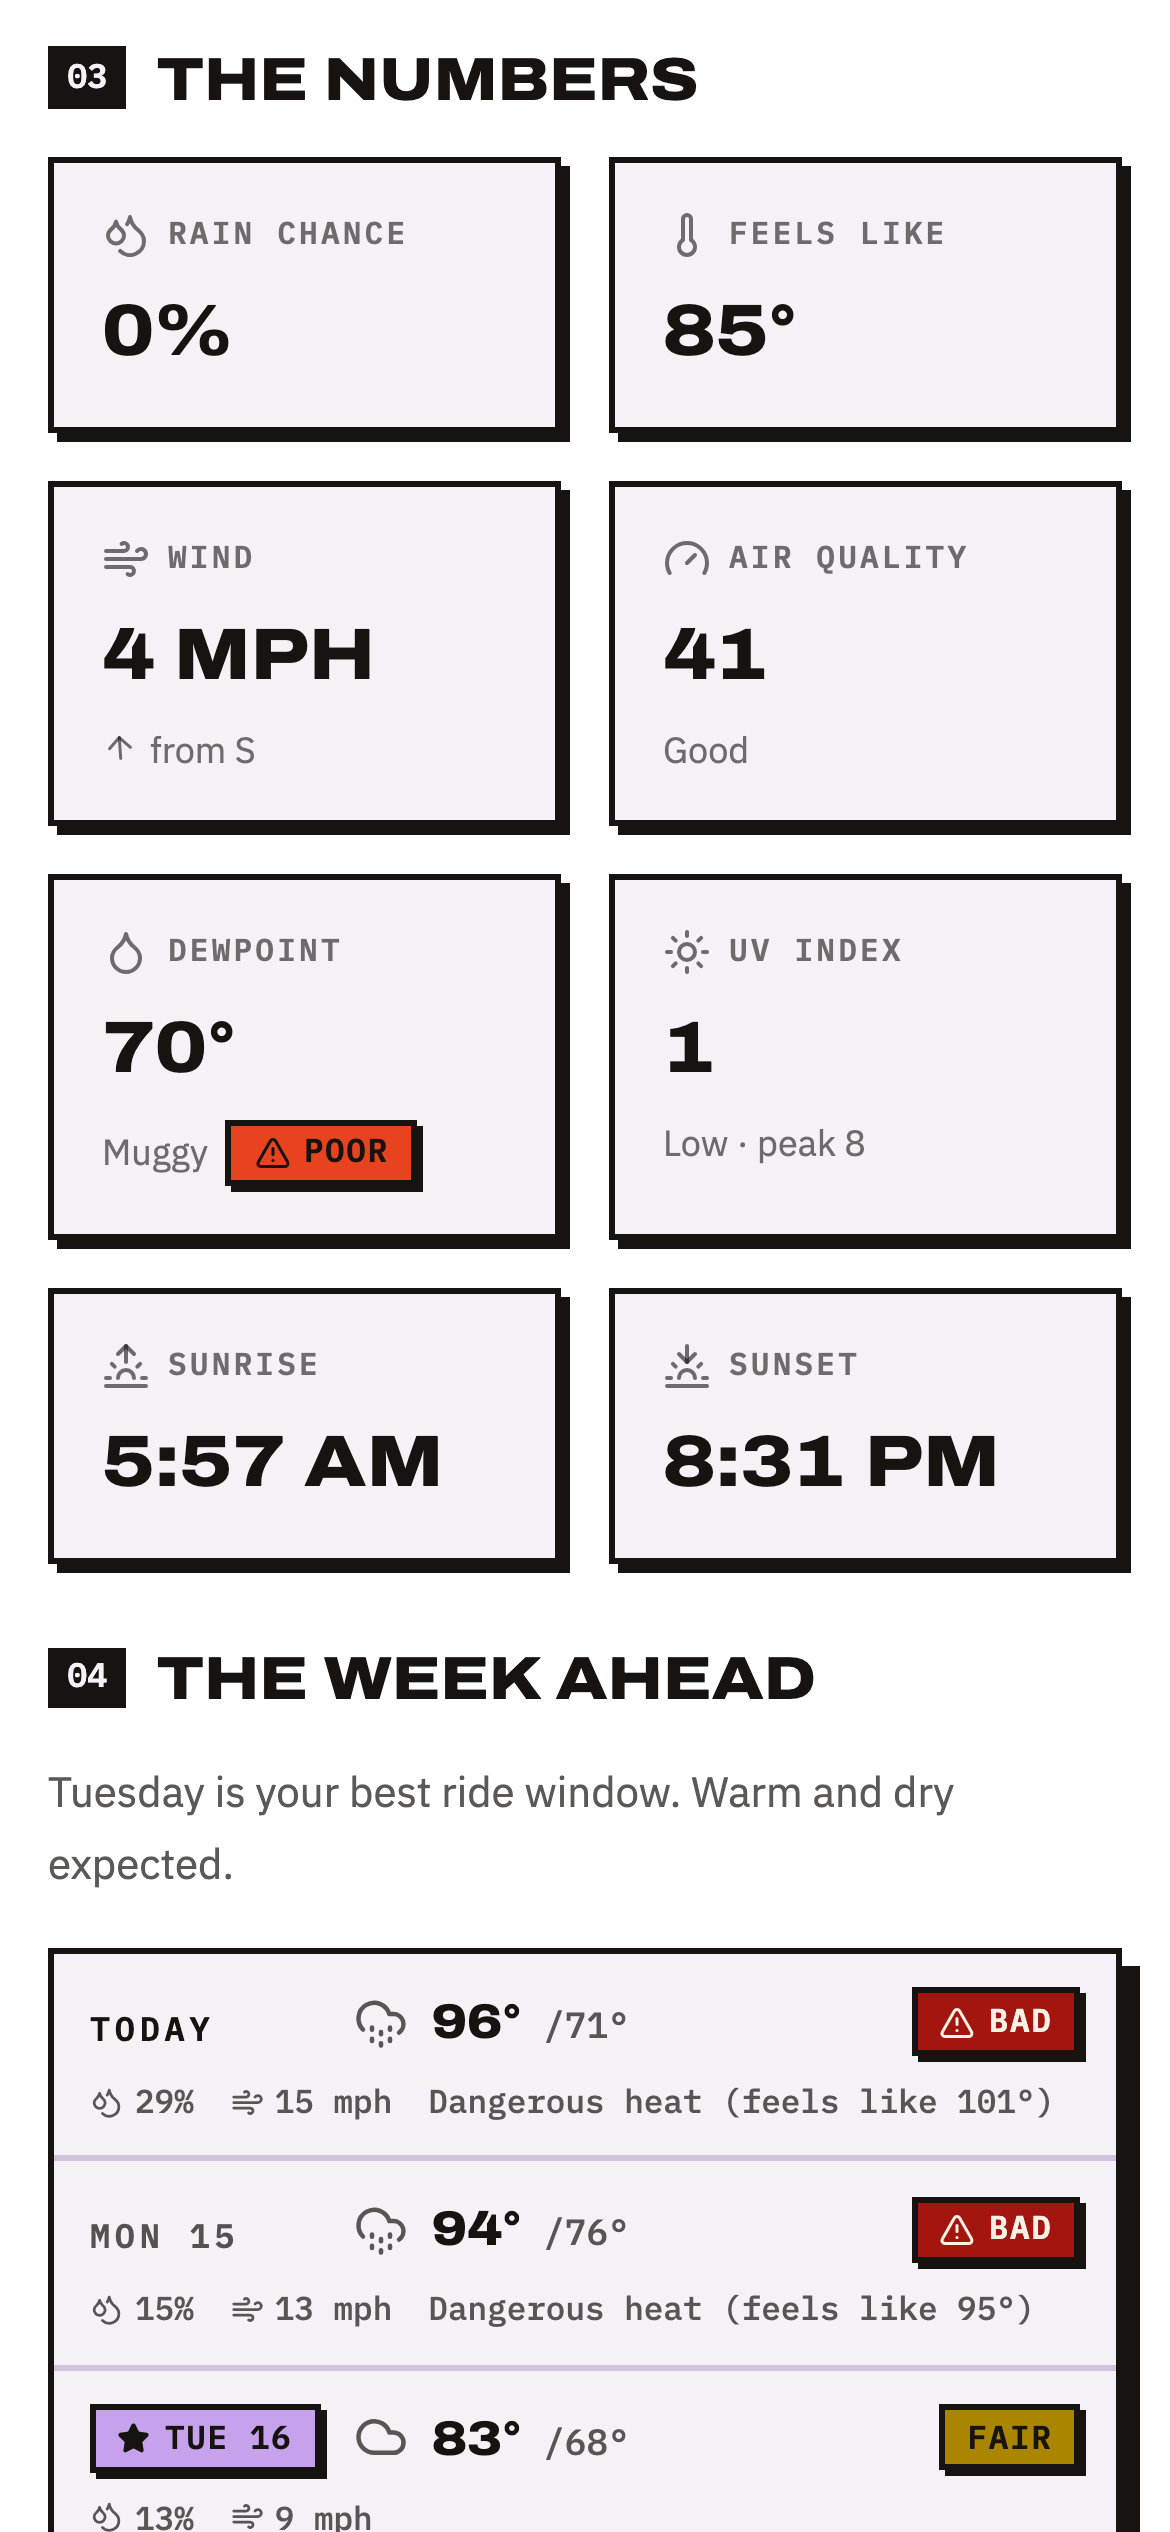
- Raw signals stay visible
- Scored on the weakest signal
Riding Windows
A bad current rating shouldn’t end the session. Hour by Hour turns a “not now” into a specific window, while the Week Ahead surfaces the best day to ride when today isn’t promising.
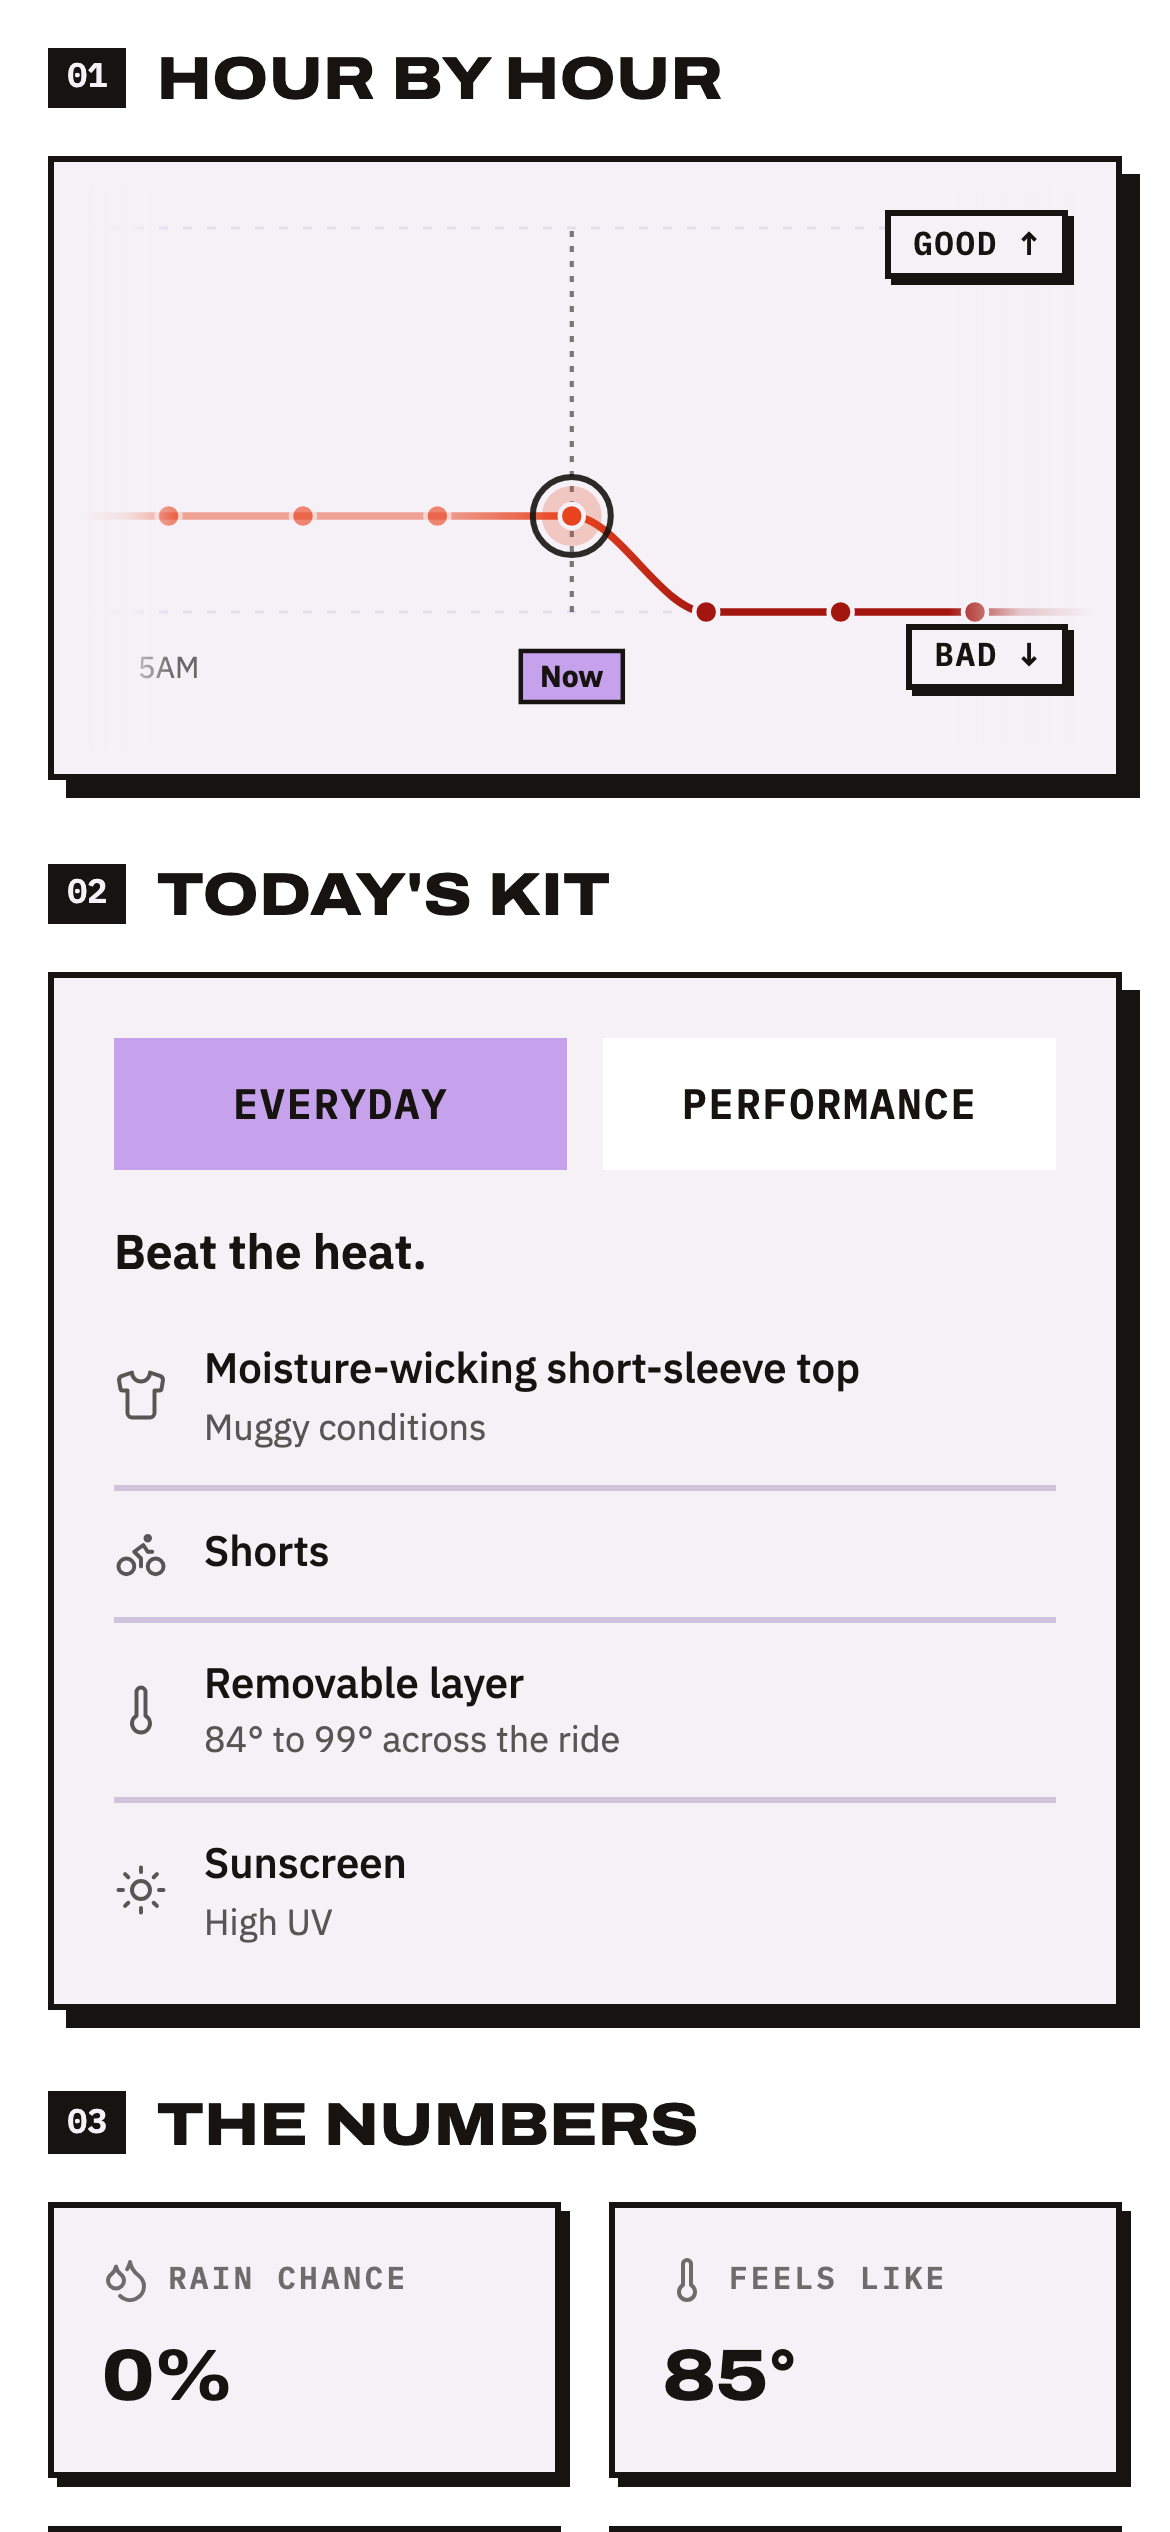
- The dip shows the window closing
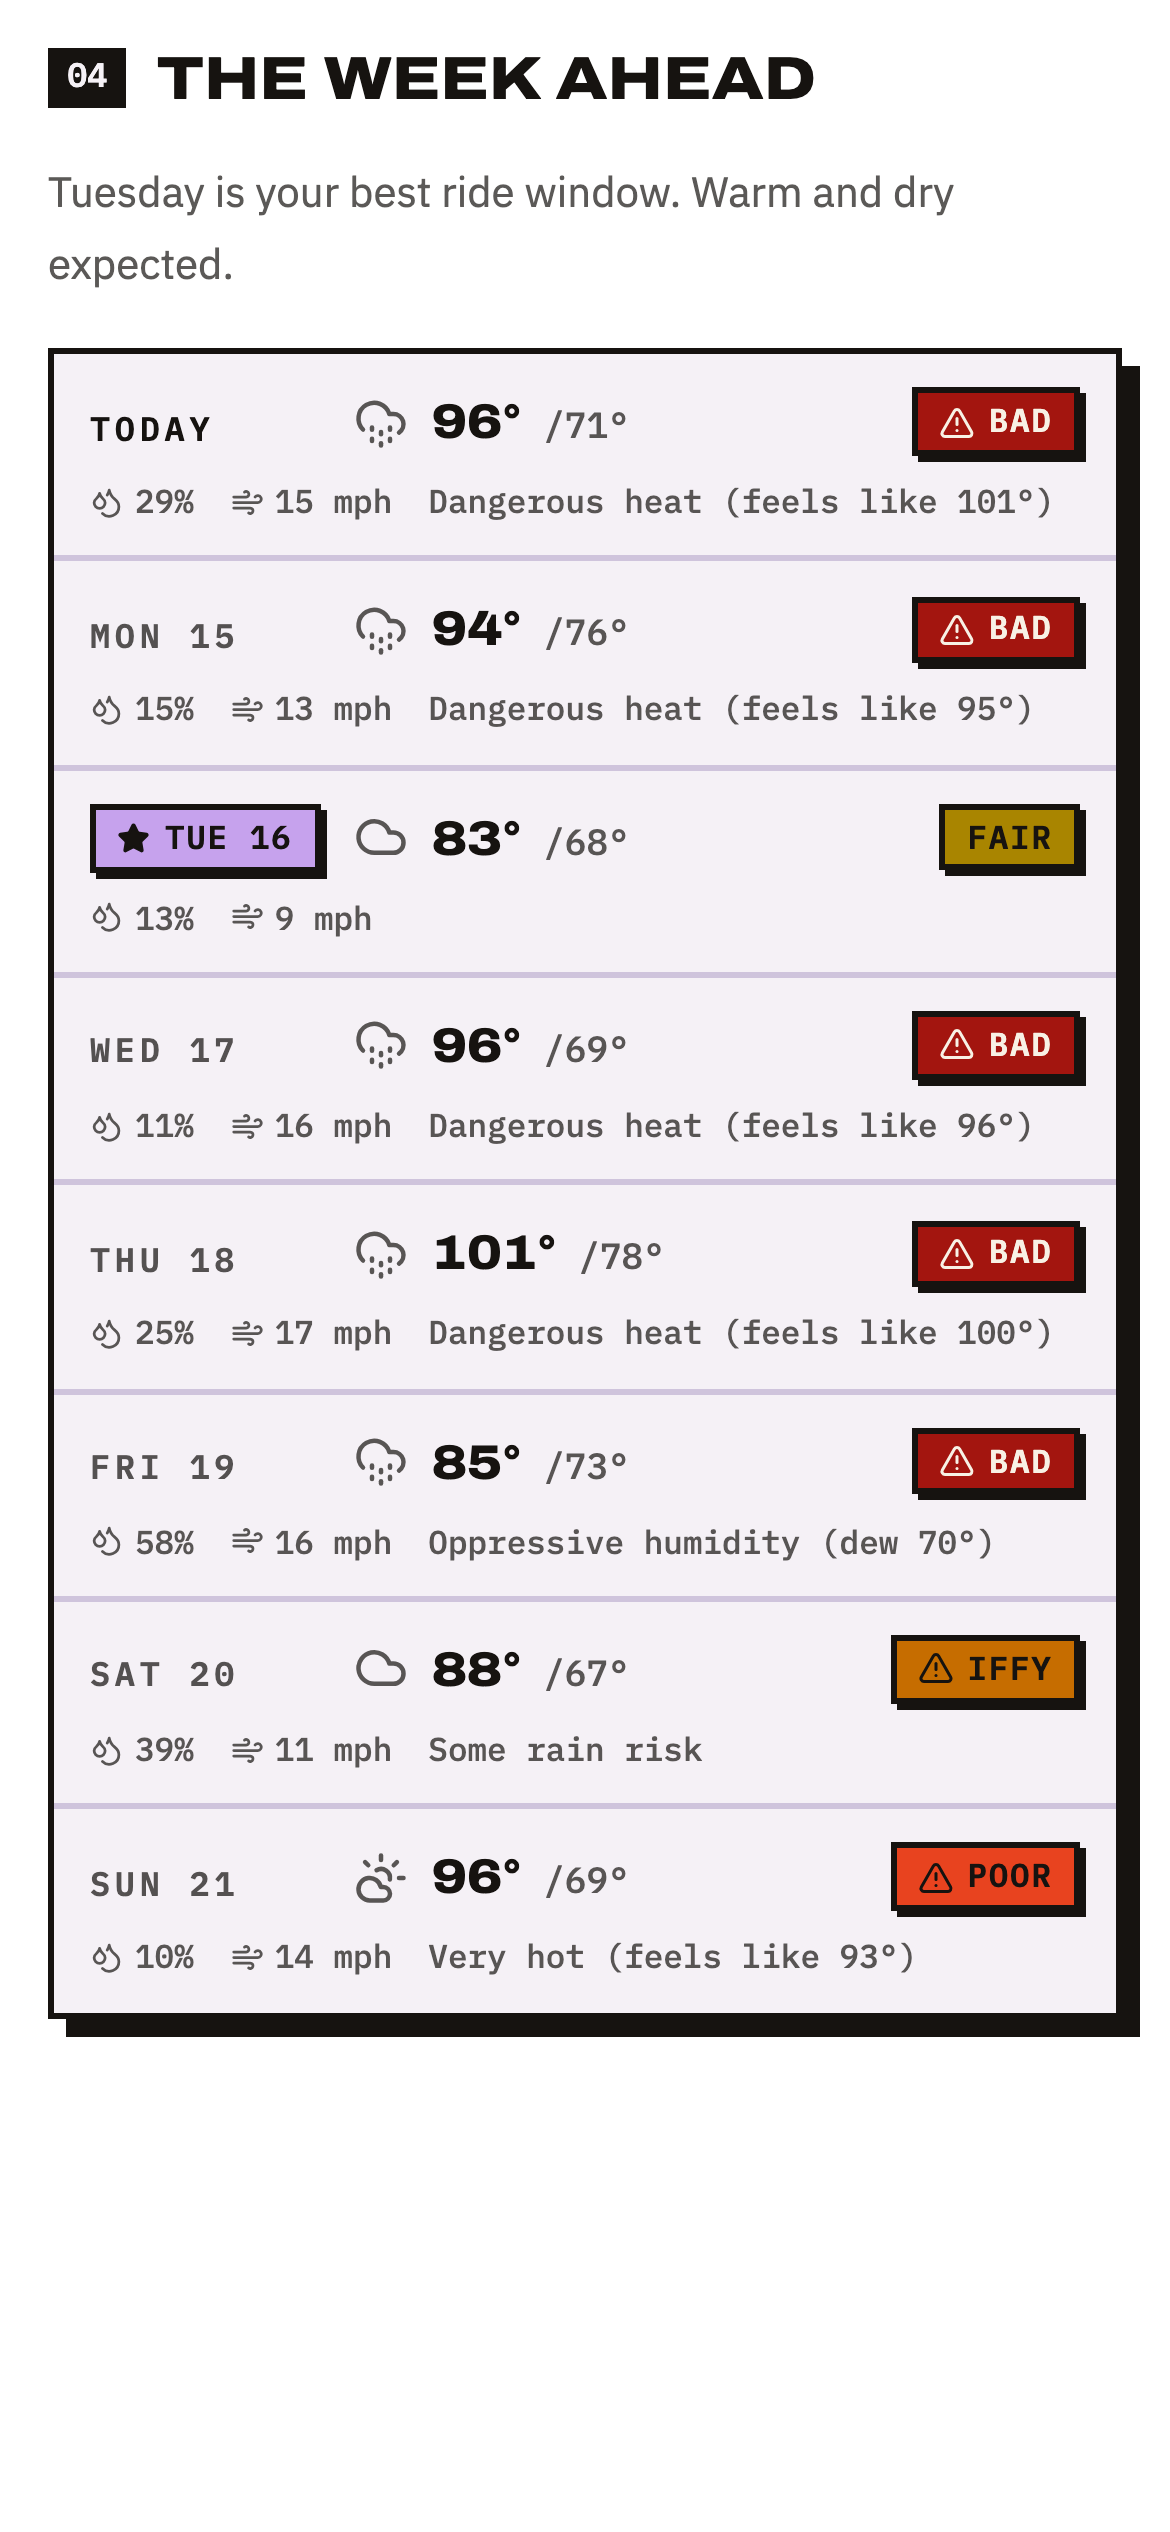
- Best ride day, starred
Outcome
Wheely Weather shipped as a focused web app on Cloudflare Pages, built with Astro, React, Tailwind, Open-Meteo, and NWS forecast data. I use it before every ride now, which is the outcome I was building toward. Next, I want a quick way to log when the verdict feels wrong on a ride, so I can sharpen the thresholds against my own disagreements before opening it up further.